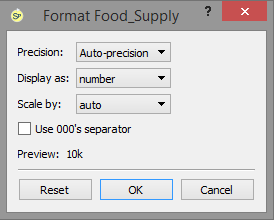
Use the Format Variable dialog box to format the appearance of variables in tables and the scale information in Graphs.
To open the Format Variable dialog box, right-click (Ctrl-click on the Mac) inside of the table or graph. Then, on the menu that appears, select Format. Select the name of the variable you want to format from the submenu that appears.

Precision sets the precision for the displayed number. This is applied after scaling is applied.
Display as allows you to specify currency (preceded by a $) or percentage (followed by a %).
Scale by will divide by thousands, millions or billions before displaying the number.
Use 000's separator, if checked, will place either a , or a . between thousands separator depending on the users locale.
Reset will reset the selected variables to use the settings they have in scales and ranges.
OK will apply the changes you have made to the current graph or table.
Cancel will not make any changes to the current graph or table.
Note: The selections you make here for precision, labeling, and scaling affect the display on the graph or table only. They don't change the way the variable is presented elsewhere in the model, or the way that its value is computed.